solar PV ABC's

There’s a lot of jargon out there. Let’s clear things up with some definitions.
First off, you have to call it “Solar PV” because there are other kinds of solar power, like solar thermal and CSP. Generally, these other technologies work by using the sunlight’s heat to make steam that powers a turbine. Solar PV, on the other hand, makes electric current out of sunlight more directly, using the photovoltaic effect… which I’ll describe in a future post.
Within Solar PV, there’s a variety of technologies as well. What distinguishes one technology from the next is its semiconductor of choice. The semiconductor is the material that actually “converts” the sunlight into electric current.
When you imagine a “solar panel,” what you’re most likely picturing is more precisely a crystalline silicon PV module. Crystalline silicon (or c-Si) is today’s most common semiconductor. It’s fairly cheap; in fact, it’s the second most common element within the earth’s crust. A few years ago, module manufacturers bought much of their silicon in the form of byproducts of the electronics industry, but by now that supply has been hugely outgrown.
Back to the solar panel you’re imagining. If you look at the module’s glossy, blue-gray surface, you’ll see the cells. They’re the little checkered quadrants, a few centimeters wide. The cells are the basic units of the PV process. It takes many cells held together by some hardware and a frame to make a solar module, and many modules mounted together make what’s called an array. So an array is what you have mounted to the roof of a house. Add the racking system, the inverter, the cabling, and possibly the battery and its accessories, and you have a complete PV system.
Back to the cells, the little quadrants on the surface. If you look closely at different arrays, you’ll notice that some cells appear to have rounded edges, while some have flush, squared ones. The rounded cells have most likely been made with monocrystalline silicon, and the squared ones with polycrystalline silicon. It has to do with how they’re manufactured. Bearing that in mind, here is a list of the 3 most common varieties of solar PV technologies.

  1. Monocrystalline silicon cells are generally the highest-efficiency, the most expensive, the longest-lasting, and the most waste-intensive to manufacture. The round part you see within the cell is the wafer, which has been sliced like salami from a cylindrical ingot of silicon. The ingot is the original “crystal” that has been “pulled” from a pool of molten silicon. The molecules that comprise the ingot are aligned in a pristine lattice pattern [3]. You might think of monocrystalline silicon as single malt whisky — unadulterated and drawn from the same barrel.
  2. The cells you see with squared edges are probably polycrystalline silicon. These cells are made by pouring molten silicon into square molds. They are more affordable and somewhat less efficient than monocrystalline… but this doesn’t mean they’re of lower quality. Lower efficiency just means they generate less electricity per unit area than mono c-Si. So unless space is severely limited, polycrystalline is probably the economically wisest option for you.
  3. If you’re looking for something a little more cutting-edge, then you might check out thin film. Instead of crystalline silicon, thin film uses any one of a variety of semiconductors, most commonly CdTe, CIS/CIGS, and amorphous silicon. To manufacture thin film solar cells, the semiconductor of choice is mounted (or better yet sprayed, sputtered, glazed, vapor-distilled, inked, or printed) onto a substrate of choice. This means you can have flexible PV laminates that conform to any curve, or translucent PV glass. Because it uses much less material than c-Si, thin film can be less expensive to produce, but it’s also less efficient (per unit area). Traditionally it’s ideal for building-integrated arrays, or for installations where design is an issue and limited space isn’t. Keep an eye on it, too, as its still very much an emerging technology.

These 3 technologies make up the majority of solar PV installations available on the market. Which to choose is up to you.
Actually, it might be less up to you than you think. In many ways, the right system for you has already been determined by your site’s potential, your energy consumption habits, and local availability. In other words, there’s already a PV system out there with your name on it… it just takes a little investigation on your part to find out what fits your needs.
 

ready?

Okay, let’s take a step back. You’re interested in installing a PV array because you want to save energy and money, and eventually to earn some ROI in energy savings and through the FIT. You aim to accomplish this primarily by generating power for your own household, rather than by exporting it, because the average retail price for electricity in the UK is about 3x the rate of what you get through the export tariff for PV.  So it’s economically unwise export when there’s laundry to be done.
Provided that these are your aims, you’d do well to have already boosted your home’s energy efficiency by simpler means, like draft-proofing and insulation. In fact, you’re obligated to do so, as your home will need to have an EPC rating of D or better (PV installation included, fortunately) in order to receive the premium generation tariff. More details available here.
If you haven’t yet taken care of that stuff, then congratulations — you can save more energy than you thought :). If you have, then you’re ready to check out solar. So let’s begin by separating issues from non-issues. Here’s a short list:

  • orientation: You want your array tilted towards the equator, usually along with the tilt of your roof. Some variation to the east or west is okay, and even full-on east- or west-facing arrays, while not ideal, can still be viable. Facing away from the equator is a no-go. If that’s your only option, consider a ground-mounted array instead. Note: solar_trackers have been proven to boost efficiency by up to 40%, but consider the potential for more required maintenance (moving parts!), and the additional cost vs. the cost of a few extra panels.
  • space: If maximizing available space is important, then cell efficiency matters. If you’re tight on space, consider monocrystalline silicon. If you’ve got lots of room, then consider a lightweight thin film installation.
  • open skies: your array should be totally shade-free for at least six hours of the day. Even a little bit of shade on one module can dampen the output of the entire array — for most technologies, anyway. I’ll elaborate on this in a forthcoming post.
  • retrofit vs. building-integrated: If you’re building a new roof, then consider integrating your modules into the roofing material. You’ll likely lose 5-7% efficiency due to restricted cooling [6], as there’s no gap for airflow, but what makes building integration desirable is aesthetics and unity of design. Still, roof-integrated modules during a new construction should cost less than a retrofitted array after the fact. If, on the other hand, you’re planning to fit a crystalline silicon array onto a pre-existing roof, then the installer may need to penetrate your roof in order to install the racking system. This will involve removing and replacing roofing material, or drilling right through it. Be assured that the MCS guidelines for waterproofing and flashing are rigorous.
  • grid-connected vs. off-grid: If you’re not grid-connected, then you won’t be able to export your excess electricity to the grid (although you’ll still be eligible for the generation tariff!). It would be wise for you to investigate battery and charge controller options.

 
And just in case you’re worried about things you don’t need to be, here are some non-issues:
 

  • compatibility: They make racks to fit roofs of all shapes, sizes, and materials. The only potential issue here is the strength of your roof. Your installer is obligated to inspect your roof for robustness before any installation commences, and racks are rigorously tested for wind- and snow-loading, although the dead weight is the most important factor. In most cases, a weak roof can be strengthened as part of the installation.
  • permissions: If you’re in the UK, you’ll be happy to learn that most pitched-roof solar arrays are considered permitted development, so you don’t need to apply for planning permission unless you live in a listed building or a special property. In any case, it’s your (MCS-certified) installer’s duty to be up-to-date on licensing and permissions.
  • maintenance: Compared to other renewables, solar is relatively maintenance-free. Still, consult your installer for recommended maintenance procedures…  a good hosing may be in order now and then to clear up dust or bird droppings.


components

One of the great things about solar PV is that you can have an array as big or as small as you please. That said, the price of most home installations ranges from £3 to £30 thousand or more, with size being the determining factor. Perhaps surprisingly, the modules themselves will probably account for less than half of the bill. You’ll be happy to know that the industry currently has its sights set on bringing the soft costs down.
So then, here’s a basic checklist:

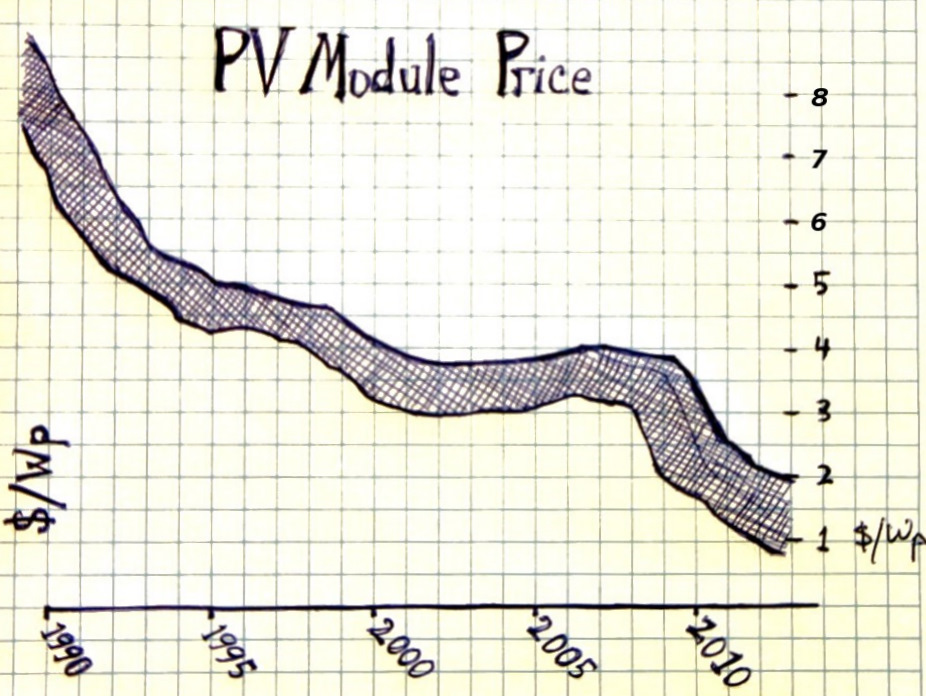
  • modules: 15-40% of total cost. Have module prices hit rock bottom?
  • racking: generally accounts for 5% to 10% of an installed system’s materials cost and 20% to 40% of labor cost [1]. Ground-mounted arrays generally use less expensive racking, but you run into other problems (shading, space). Flat roof installations are easier to rack as well, though you’ll probably need planning permission (except for in Scotland).
  • inverter: 8-10% of total initial cost, though you should plan on replacing it after 10 – 15 years. Recent innovation has brought us the built-in micro-inverter, a technology that enables each cell to have its own tiny inverter, and thus to export its own AC current.
  • cables & hardware
  • labor: could be up to 40% of your total initial cost, especially if any roofing needs to be strengthened before the installation begins.
  • fees: your DNO may charge you to conduct a study to test the impact of your newly installed system on your local grid. Find out more here.
  • storage (off-grid): If you’re not connected to the mains, then you should look into storing the extra power you generate.  Along with a a battery, you’ll want a charge controller as well. This monitors the trickle of charge-up current so that once your battery is full, the current doesn’t reverse its direction and damage the load.


sample bottom line

Now for the good part.
Let’s say you go for a 4.8 kWp installation, something on the order of 20 panels. This is a little larger than average, but let’s say you use more energy than average as well, a robust 5 thousand kilowatt hours per year. Your house has a good EPC rating, and you live in Manchester. You pay 14 p/kWh for electricity, which adds up to £700 per year.
Right. So when the installation is said and done, you’re out £9,600. (This is assuming an installed price of  £2 per Watt-peak, but you should be able to find a better deal!) The important thing is, you start earning on day 1: 13.99 p per kilowatt-hour under the generation tariff (for the next 20 years), 4.5 p per kW-hour for electricity exported, and then, most importantly, the energy you don’t have to buy from the grid.
Based on insolation data for Manchester — and if your site is good — this installation should generate over 3.5 MW hours (3500 kW hours) in one year. (An idealized way to imagine 3500 kWh is to imagine 1000 hours of sunshine that, once it hits your array, is 3.5 kilowatts strong. So for 1000 hours, your array generates 3.5 kW, which is 73% of its “peak” capacity of 4.8 kWp.)  Expect production in the summer months to be some 3 to 5 times greater than in the winter months [6]. This means you might be exporting in the summer, but probably buying power from the grid during the wintertime.
During the month of May, for example, your installation could be humming along at near full capacity for almost half the day long, and by the end of the month it might have generated 500 kilowatt hours. Even though your usage for May was probably less than 500 kWh — say, 400 kWh — you still had to buy 90 of this 400 kW from the grid in order to keep your lights on and watch some television after supper, when your array wasn’t generating. So of the 500 kWh generated that month, you only used, say, 310 kWh yourself, meaning you exported the remaining 190 kWh. Your total for May, then, is as follows: £43.40 from the 310 kWh that you didn’t have to buy from the grid, plus £69.95 for your 500 kWh from the generation tariff, plus £8.55 from the export tariff (the 190 kWh you sold to the grid), minus £12.60 for the 90 kWh you had to buy to keep your lights on after dinner. Congrats, you’ve netted £108.30 for May!
During December, on the other hand, your installation might put out only 100 kW hours. You’ll have to turn your lights on earlier because it gets darker earlier, and you probably won’t be exporting anything. Assuming that your December usage is 400 kWh, then you’ve saved about £14 by not having to buy from the grid and earned an additional £14 from the Generation Tariff. Not much, but it will add up.
With an installation like this, expect a return of somewhere between £600 and £900 per year.
Luckily, maintenance will be minimal. Rain should keep the modules clean, though speak with your installer about recommended upkeep. Most solar modules have warranties of 20 years or more, and you can expect an installation to last over 25 years — and by then, who knows what your upgrade options will be. A caveat: you will probably need to replace your inverter at some point during this period. Count that as £1k against your net profits.
In the final calculation, this larger-then-average rooftop installment on a consumption-heavy Manchester home pays for itself in 11 – 17 years. After that, the £600 – £900 generated per year is shear gravy.
You can find lots of other similar estimates on the web, as well as more personalized ones. It’s not unheard of for a solar PV installation in the UK to pay for itself in 7 years or less. If you really want to get started, check out our search engine.


 Cited Material

  1. http://www.homepower.com/articles/modern-pv-roof-mounting
  2. http://energyinformative.org/best-solar-panel-monocrystalline-polycrystalline-thin-film/
  3. http://www.siwavecorp.com/knowledge.htm
  4. http://www.rmi.org/simple
  5. http://www.solstats.com/blog/solar-energy/how-much-does-it-cost-to-install-solar-panels-in-the-uk/
  6. http://www.spiritsolar.co.uk/solar-power-products.php
Posted in renooble, solar-PV | Tagged , , , , , | Leave a comment

status update: solar PV

the state of the market

In case you missed it, the solar photovoltaics industry was this past decade’s hottest drama. Here’s a quick summary: ground-breaking innovations, shortage of raw materials, dubious intellectual property practices, oversupply, sub-cost dumping, bankruptcies, international lawsuits, buyouts, and sudden public policy shifts that sent everybody scrambling. The dust is far from settling, too.
The bad news is that in a market this ferocious, emerging technologies have a hard time taking off. Currently we’re in a phase of oversupply, so the surplus will have to drain before new stuff enters the production lines [3]. The good news is really good. Take a look at this graph. Module prices have plummeted—as much as 62% in the two years leading up to September 2012 [1].

PVpricegraph

rough average of global PV module selling price over time in $USD/kilowatt-peak. Kilowatt-peak means installed capacity — i.e., this graph assumes maximum factory-rated efficiency of modules.


So we’ve reached $1/Watt-peak for modules. What does this mean?
It means that now, there are sizable regions of the globe where solar PV is an economically viable way to make electricity, even without government subsidies. Specifically, these regions are sunnier parts of the developing world where liquid fuels are used for power, like much of India, parts of the Middle East, parts of Africa, or on islands like Hawaii and Bermuda. Moving into subsidized markets: retail grid_parity has already been reached for much of Australia [2]. Even in Texas—who would have thought?—solar is now “highly competitive” with natural gas, reports Forbes [4].
The market has driven innovation so strongly that since 2011, focus has shifted to trimming the fat off installations as a whole. Developers are cutting down on what’s known as balance-of-system (BoS) costs—that is,“soft costs” like racking systems, metering software and paperwork. According to the RMI, this is where we’ll see lots of development in the immediate future [5, 6]. Additionally, innovations in manufacturing boost the affordability of, well, everything. And this is not to say that developments in PV cell technology have stopped, either.
So! Is solar PV finally going to beat out fossil fuels?
That’s a complicated question, and in fact, it’s not a very helpful one. I know I mentioned grid parity earlier, but this is only a vague benchmark, not an argument. The truth is that fossil fuels and solar PV have big qualitative differences. For one: because solar irradiation varies across our round planet, there can be no fixed global rate, i.e. no “dollars per barrel” like oil has. Nor is solar dispatchable—it can’t be turned on or off in the same way that fossil fuels can. Thirdly, as for rooftop PV, taking the step to install solar modules at your home still requires an up-front investment, of course. Solar PV vs. fossil fuels quickly becomes a case of apples and oranges.
While these differences might be obvious, their implications for the energy sector are less so. In the next section, I’ll tease one out. Continue reading

Posted in inspiration, renooble, solar-PV | Tagged , , , , , , , , , , | Leave a comment

a kilo-what?

In California, company Gen110 decided to quiz people about fuel prices and electricity prices. These are the results:

This reveals the difference in awareness between electrical bills and fuel costs. Yet one can easily spend a similar amount of money on electricity and gas than on fuel.  So perhaps we should ask ourselves … What is a “kilowatt hour” anyway?
A Watt (also abbreviated as W) is a unit of power (just like the hp or horse power unit).  A small efficient lamp requires little power (3W or 4W), but a tumble dryer needs lots (about 2,400W).  1000 watts are called a kilowatt, or kW.
Now take a kettle.  Kettles typically have power ratings of 1000W, or 1kW.  The unit to measure energy (the famous kWh or kilowatt hour) is the energy spent running the 1 kW kettle for one hour. Running your kettle for one hour would make about 15 brews.* So the price per kWh on your energy bill tells you the price of 15 brews of your kettle, if you like.
So next time you see a bill with a price of £14c/kWh** (14 cents for each kilowatt-hour spent) you know your 15 brews cost you around 14 cents (plus a few little extras the utilities add for their benefit).  This may seem like very little.  But of course add the fridge, washing machine,  dryer, dish washer, light, heater, … and it starts to add up.
And you?  Do you know how much you’re paying for your 15 brews (or kWh)?
 
* assuming you use a kettle with 1 liter in it and it takes 3.5 minutes to boil with minor inefficiencies.
** because electricity is sold by kilowatt hour (kWh), it is more correct to say that the power company sells energy, not power.  Energy is power carried out over a period of time — like running your kettle for an hour.

Posted in inspiration, policy | Tagged , , , , , , , | Leave a comment

Can you do the Green Deal yourself?

This month, the UK’s DECC launches its Green Deal. It’s basically a way to finance energy-efficient home improvements — you pay for your upgrades with installments tacked onto your power bill. The idea is that your upgrade payments are offset by your new energy savings… so it all evens out, theoretically.
Sounds like a Deal, right?
First item: if you act now, you may be able to come out on top of this one thanks to a first-come, first-serve cashback.
Apart from this, though, check out the fine print. The Guardian‘s Adam Vaughan points out that before your Green Deal Provider can make Green Deal Improvements with your Green Deal Plan, you have to get a Green Deal Assessment. Note the table at the end of the article — Vaughan did some work to find out who charges what among the Green Deal Assessors. You’ll probably pay £100 before you even choose a plan — if you need one at all.
Now, some companies (i.e. Mark Group) will do an assessment for free, and “two of the companies contacted by the Guardian,” writes Vaughan, “said they would refund the full assessment fee, or part of it, if works were also carried out with them.” A DECC spokesman whom Vaughan contacted is under the impression that “it is likely that some providers will offer free assessments as a way to attract customers.” So the program has free market intentions.
In the mean time, the Green Deal is just dolled-up financing. This might help with big steps, like installing solar panels or a new boiler. But step one is insulation. So if you’re so inclined, why not roll up your sleeves and give your house its own assessment? Here are some guidelines that Alvaro found:
http://energy.gov/energysaver/articles/do-it-yourself-home-energy-audits
http://www.myenergysolution.com/home-energy-basics/diy-audit.html
http://www.thedailygreen.com/green-homes/latest/DIY-home-energy-audit
http://www.guardian.co.uk/money/2013/jan/28/green-deal-home-improvement?INTCMP=ILCNETTXT3487
Happy auditing!

Posted in incentives, policy | Tagged , , , , , | Leave a comment

2 Useful Maps

First off: Happy Noo Year!
We’ve got some graphics to share, brought to you by our friend Sachin Navalkar. The first one combines wind speed and population density data, giving a more complete, more realistic image of where in the UK a wind turbine might be effective.

average wind speed and population density

If you live within one of the shaded dots, then it’s likely that your local built environment prevents consistent, high speed winds from reaching your site. But if you live in an area not so densely populated, and your proposed site has a high average wind speed, then there might be a turbine with your name on it!
Keep in mind that bit about the local built environment. This map doesn’t account for orography — the zones are smoothed-over approximations, exempting hills and valleys from the data (see a more detailed map). As always, the best way to measure your site’s average wind speed is with an anemometer.
Remember too that power as a function of wind speed increases cubically, so each meter-per-second of wind speed counts a great deal. See “The Skinny on Small Wind” for more details.
The next graphic is on solar power. The video shows the variation of solar irradiation throughout the year, measured in kilowatt-hours per square meter; i.e., sunlight power density. Notice the difference between the summer and winter months, especially as you move away from the equator. The moral of this story: expect your panels to produce 2-3 times the power on a sunny summer day than on a sunny winter day.

If the embedded video doesn’t work for you, check it out here.
That’s all for now — we do hope you’ll stay tuned for updates this 2013.

Posted in solar-PV, wind-energy | Tagged , , , , , , , , | Leave a comment

The Skinny on Small Wind

Summary: Wind is volatile. The conditions for effective wind harvesting greatly favor rural areas. Turbulence can be a problem for building-mounted turbines. Height above the ground makes a big difference. Feed-in Tariffs keep small wind economically viable in the UK. A properly-placed turbine can pay for itself after a few years.

– – –

You can see wind’s effects on the environment, sure, but have you ever looked for the environment’s effects on wind?
Consider a house that stands 5 meters tall. Wind doesn’t simply hop over this house and keep going. No, the wind throws a fit of turbulence. Turbulence will be found on the upwind side of the building, directly above it, on either side of it, and downwind of the building as well — as far as 100 meters downwind. Give this building a bunch of neighbors, and the best breezes bypass the whole lot. Wind may be powerful, but it’s extremely volatile as well.
For the building-mounted turbine, then, turbulence poses a fundamental dilemma: the house on which it’s mounted reduces its effectiveness.

 wind flow around buildings

The warmer the colour and longer the arrow, the greater the wind speed. The ‘isolated’ case is equivalent to a rural setting in context of this report, while the ‘Urban’ case depicts a building in an urban environment with other buildings nearby on either side (not shown). Source: Centre for Renewable Energy System Technology (CREST) at Loughborough University. As seen in Small Scale Wind Energy: Policy Insights and Practical Guidance. The Carbon Trust, 2008.

Under the right circumstances, it is feasible that a building-mounted turbine could be economical. Turbines mounted on high rises have performed well, for example. And, of course, it’s less expensive to mount a turbine onto something that’s already there. Some houses do have exceptionally good wind exposure. But if we’re going to generalize, the best place for a small turbine is usually right where you’d expect: pole-mounted, in a clearing, atop a small hill, with the sheep grazing around it.

 – – –

orography and the physics behind wind

To conceptualize, rid yourself of the notion that wind is a linear force that sweeps evenly across space. Remember that wind is essentially the equalization of the air’s heat across zones of variable temperature and pressure. Everything this air touches has a shape and a temperature of its own, and these properties are in turn transferred to the wind, affecting how it continues to flow.
Place your hand near the ground and you’ll feel that even the flattest surface turns a breeze into still air as the wind moves across it. This is called drag. In order to escape this dead air, you have to go up. As elevation increases, wind speeds increase drastically for the first few meters of elevation, then taper off. This logarithmic increase in wind speed is known as vertical wind-shear.
Herein lies the problem with turbines in urban settings. When wind encounters a cluster of houses, the shear of the wind is displaced upwards, because to the wind, the rooftops present a new ground level. In other words, a turbine mounted 2 meters above a rooftop in a subdivision will be about as effective as a turbine mounted 2 meters above the ground in a field—something you don’t see very much. Raising this turbine from 2 to 9 meters above the rooftop — where it can access strong, consistent winds — is likely to triple its yield at leasti, although it is likely to compromise the structure of the house as well. Again, building-mounted turbines prove tricky.


But is it really worth the trouble to hoist your turbine way up into the air for a few extra meters-per-second of wind speed? Yes, in fact: as wind speed increases, the energy within the wind accessible to the turbine increases cubically. Put crudely: double the wind speed means 8 times the power. This is the physical formula, anyway; in reality, other factors like cut-in_and_cut-out_speeds enter the calculus,  so a turbine’s power approximates this cubic relationship only across a practical range of wind speeds. This range will be evident in your model’s power_curve.
The point remains: the extra cost incurred to mount your turbine higher will prove to have been well worth it.

– – –

finding a site

Okay, so you’ve got a potential site for a turbine. You know that the wind at your proposed hub height is turbulence-free because you put a ribbon on the end of a pole and observed a constant stream rather than a squiggly, erratic dance. The next step is to get a definitive read on the site’s wind speed. Continue reading

Posted in incentives, policy, renewable-energy, wind-energy | Tagged , , , , , , , , , | Leave a comment

Wind Energy, Perú and the Energy Challenge

Our co-founder Alvaro was invited by the University Agraria de La Molina in Lima, Perú to give a talk on wind energy.  He gave a talk for engineering, environmental science and policy students, describing the world’s energy situation and some exciting trends in wind energy.  The talk can be found below as a zoomable presentation to give a better overview of the proportions involved. For instance, … Perú would need to run its hydroelectrical plants (60% of its electricity) for 2,200 years to match a year of world oil consumption!  Or all the small wind turbines ( below 100 kW) of the world running for about 150,000 years.   With these orders of magnitude it’s pretty clear that the world faces an incredible challenge to substitute fossil fuels.  As global citizens, we need to explore all possible avenues renewable energy can offer whether it’s small, medium and large scale.  And we need to understand that whatever technologies we adopt they will have an impact (in our back yard or in someone else’s).  At renooble we believe small scale renewables help us appreciate our energy needs, their impact and why being more efficient and responsible will eventually be the only option.
However it is still encouraging to look at the trends and macro-perspective.  The world’s wind energy potential could be greater than what is provided yearly by fossil fuels.  The world consumes yearly 150 units of energy (Peta Watt Hours for those interested). Large wind produced in 2011 between 0.3 – 0.4 of these units.  However this is doubling every 4 years approximately.  And small wind is growing even faster at something like 20% – 25% per year (in the midst of the financial crisis).  But is there enough wind for everyone?  If we tried to tap most of the wind energy in the world we could obtain between 100 – 1000 of those same units of energy.  This big range comes from the uncertainties in the calculation.  How many places in the world have wind speeds above 6.5 m/s? How far apart should we place the turbines? Will turbines get more efficient? When we take some energy out of the wind, will the upper layers of the atmosphere replenish this energy? If so how fast? etc, etc.  [Lu,McElroy 2009UD-Archer Article 2012TOD Article ReviewJacobson-Archer (2012)].
But if there is enough wind, a more pressing question is if we can afford it.
Continue reading

Posted in policy, renewable-energy, wind-energy | Tagged , | Leave a comment

Amory Lovin's 40 year plan, or reinventing fire

Posted in inspiration, renewable-energy, renooble | Tagged , , | Leave a comment

Presentation

We’re Alvaro and Hannes, two renewable energy enthusiasts ready to change the world. We also believe countries are moving too slow when it comes to making the energy transition from fossil fuels to renewables and we want to change that.
Alvaro is half-Spanish, half-French and earned a PhD in Quantum Physics from Imperial College London (UK). He’s worked for 2 1/2  years for Vestas on large scale wind energy technology, and has built small scale biogas generators, solar ovens and wind turbine models.  He loves learning new stuff like Python and Emacs shortcuts.  He can swallow and process large chunks of Big Data and turn them into useful beautiful webpages.
 
Hannes is a German electrical engineer, who believes that we should be generating energy locally, sustainably and at the real cost. Hannes is a re.nooble co-founder and a part-time re.nooblist. During the day time, he works for “big business” in the energy sector. During the night time, he turns into a dedicated re.nooblist. He’s the core software developer and an open source enthusiast.
 
You can find out more about the website development on  our technical blog,

Posted in company, renooble | Tagged , , , , | Leave a comment